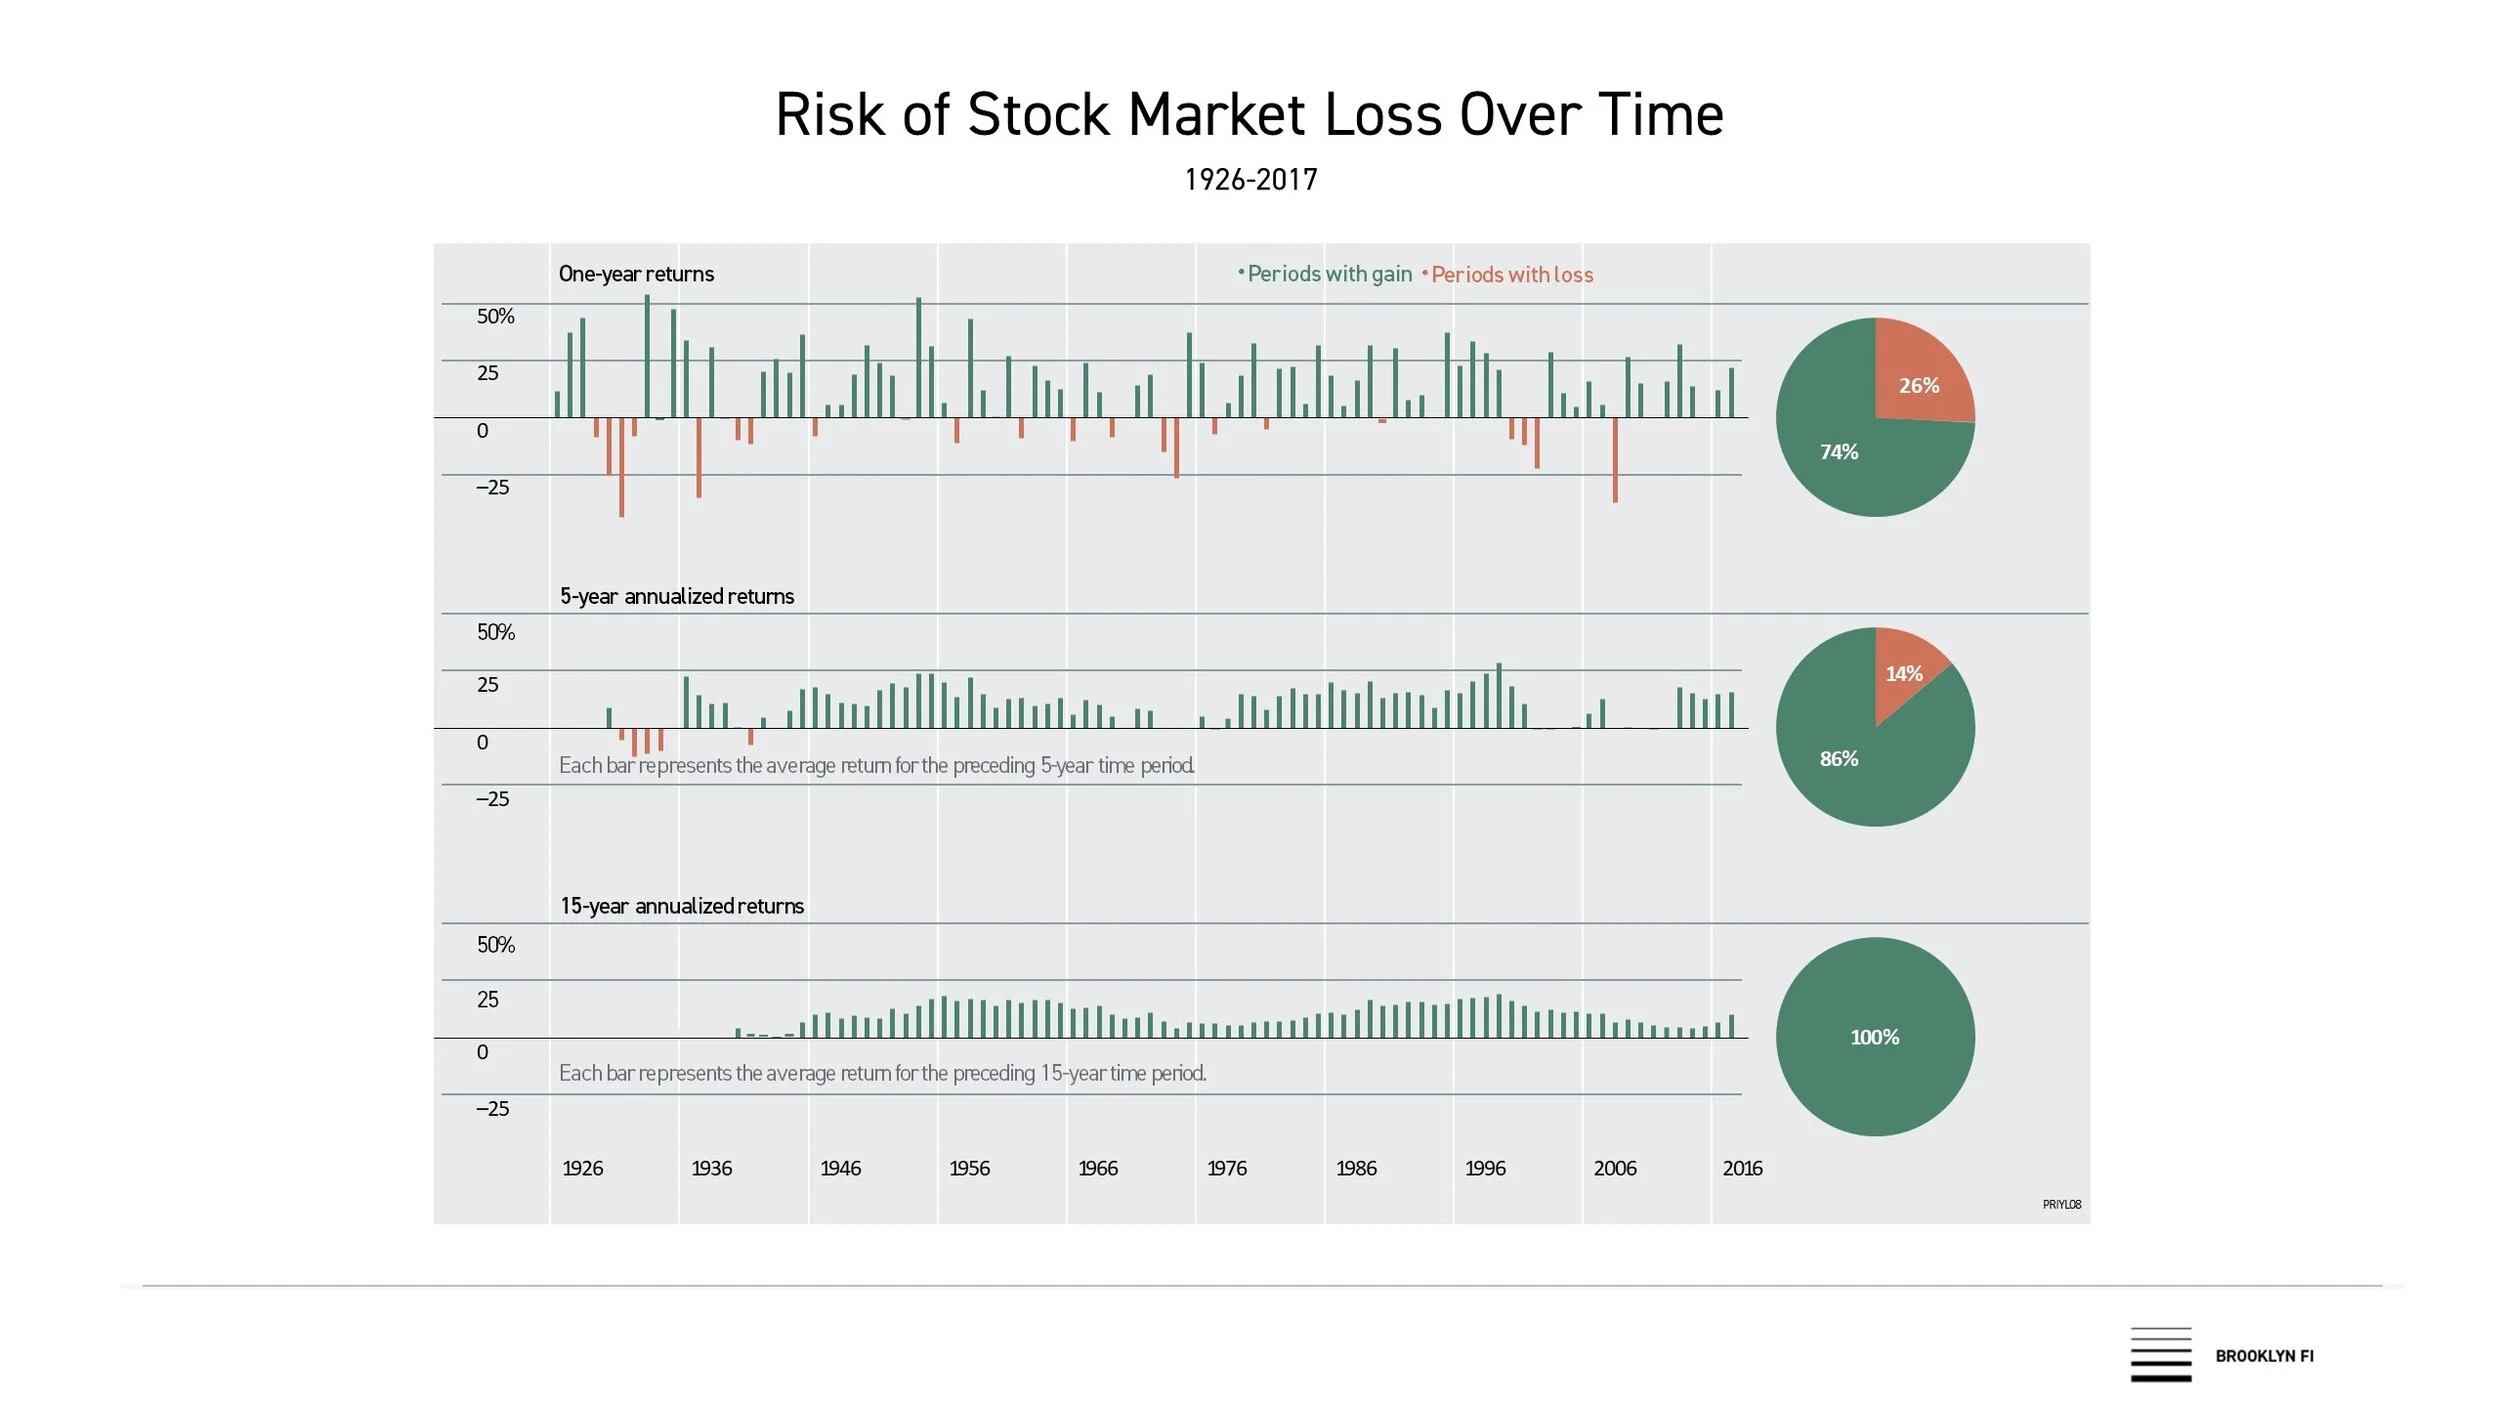
These are annualized returns for the stock market over different lengths of time: 1 year, 5 years and 15 years.
What this shows is that 25% the time the stock market (and likely the corresponding diversified portfolio) is going to be lower 1 year from now than it is “today.” You can clearly see the stock market crash of 1929 and even the 2008 financial crisis fall deep into the red/negative territory.
What this also shows is that 0% of the time, or never in the history of the stock market, has the market (and likely the corresponding diversified portfolio) been lower than it is today over a 15 year time horizon. So even though we may see lasting economic impact from the current crisis, it’s very likely that your investments will recover with time.
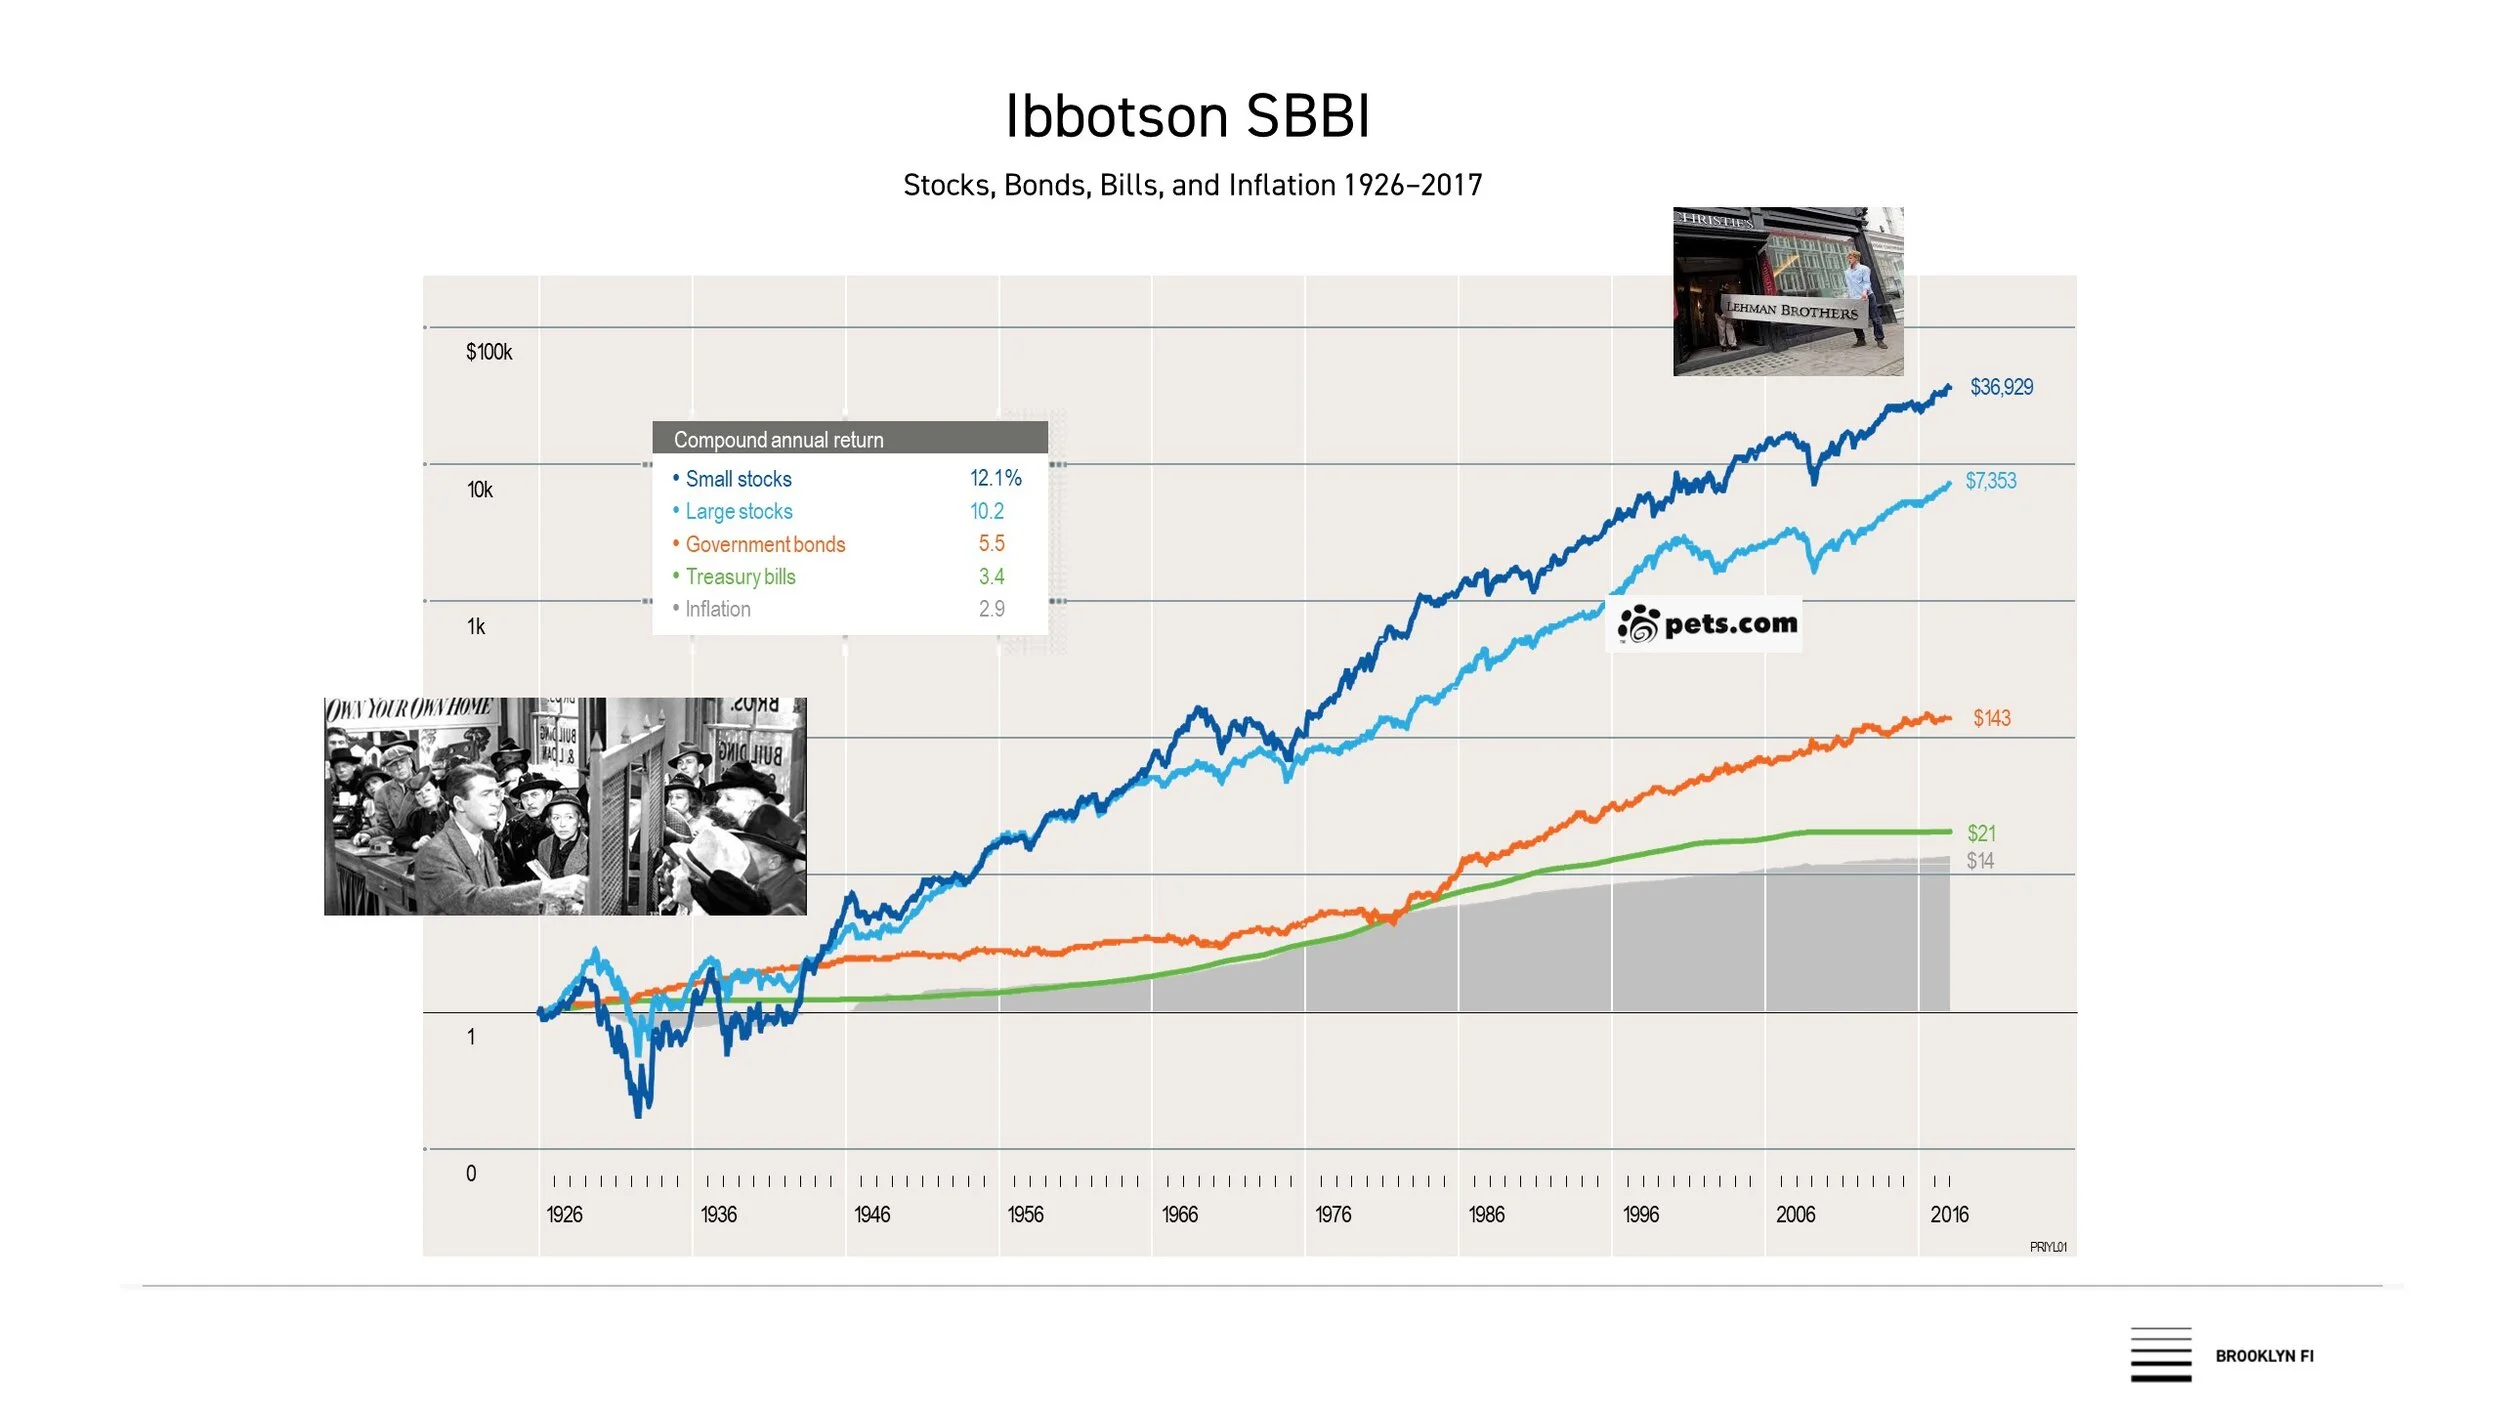
Here’s the “Ibbotson SSBI” which shows how different assets have done over 90 years of the stock market. Here we can clearly see how dramatic crashes in the past are evident in the blue lines showing stocks. We’ve highlighted some truly historic volatility like the stock market crash of 1929 (It’s A Wonderful Life), the dot-com bubble bursting in 2001 (Pets.com) and the global financial crisis in 2008 (Lehman Brothers). Still, with time we see that the market recovers and continues to trend up and to the right over time.